
How to Debug Code Like a Pro: Tips & Tricks
Debugging is an essential skill for any developer. Whether you're working on a small script or a large-scale application, finding and fixing bugs efficiently can save you hours of frustration. How to Debug Code Like a Pro: Tips & Tricks
david aim
2/17/20252 min read
1. Understand the Problem First
Before you start changing code, take a step back and understand the issue. Ask yourself:
✔️ What is the expected behavior?
✔️ What is actually happening?
✔️ What part of the code is responsible?
Reproducing the error consistently is key to identifying the root cause.
2. Use Print Statements (But Wisely!)
One of the simplest debugging methods is inserting print (or console.log() in JavaScript) statements to track variable values and program flow. However:
🚫 Don’t clutter your code with too many print statements
✅ Use logging libraries like Python’s logging module or JavaScript’s console.table()
Example in Python:
python
CopyEdit
import logging logging.basicConfig(level=logging.DEBUG) logging.debug("This is a debug message")
3. Master Your Debugger
Modern IDEs come with built-in debuggers that allow you to:
🔹 Set breakpoints
🔹 Step through code line by line
🔹 Inspect variables at runtime
Example: If you're using VS Code, add breakpoints by clicking on the left margin and running the debugger.
4. Read Error Messages Carefully
Error messages aren’t just there to annoy you! They often tell you:
📍 The file and line number where the issue occurred
📍 The type of error (e.g., NullPointerException, SyntaxError)
📍 A stack trace to help trace the issue
Instead of guessing, Google the exact error message—you’ll likely find a solution in minutes.
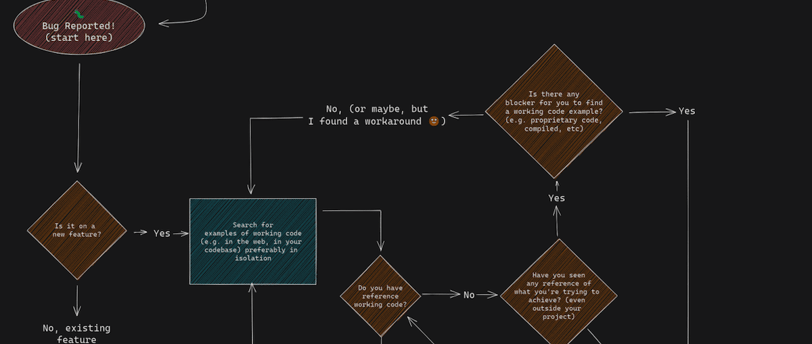
5. Isolate the Problem
🔹 Comment out unrelated parts of your code
🔹 Use a binary search method (comment out half the code, test, then refine)
🔹 Create a minimal reproducible example
If the issue disappears when you isolate a function, the problem is likely elsewhere.
6. Check Version & Dependencies
Sometimes, issues arise due to:
⚠️ Outdated dependencies
⚠️ Incompatible library versions
⚠️ OS or environment conflicts
Use pip list, npm list, or composer show to check your installed versions and update them if needed.
7. Use Code Linters & Static Analyzers
Tools like:
✔️ ESLint (JavaScript)
✔️ Pylint (Python)
✔️ SonarQube (Java)
…can automatically detect issues before you even run your code.
8. Leverage AI & Online Communities
🔹 ChatGPT, Copilot, or Bard can suggest fixes
🔹 Stack Overflow & GitHub Issues are great resources
🔹 Forums & Discord channels help when you're stuck
Tip: When asking for help, always provide a minimal example of the issue.
9. Learn from Debugging Logs
If your application has logging, read the logs before debugging blindly. Tools like:
📜 tail -f logfile.log (for real-time logs)
📜 Graylog, Loggly, or ELK Stack for advanced logging
…can help track down elusive bugs.
10. Take a Break
If you’ve been debugging for hours with no progress:
🔹 Step away from your desk
🔹 Explain the issue to someone else (Rubber Duck Debugging)
🔹 Sleep on it—solutions often come when you’re not actively coding!
Final Thoughts
Debugging is an art. By combining structured approaches with the right tools, you can identify and fix bugs more efficiently. What’s your go-to debugging trick? Let us know in the comments below!
🚀 Share this post with fellow developers who need better debugging strategies!


I am David Aim, a 41-year-old software and web developer with a passion for building innovative and efficient digital solutions. With years of experience in coding, optimization, and web technologies, I specialize in creating high-performance applications that solve real-world problems. Whether it's streamlining backend processes or designing user-friendly web interfaces, my goal is to develop software that makes a difference.
Innovate
Crafting solutions for modern software development needs.
davidaim.io © 2025. All rights reserved.
Connect